
Blinkit Power BI Dashboard
Overview Of Project
+Developed a comprehensive Power BI dashboard for Blinkit to analyze key business metrics across sales performance, customer behavior, and feedback insights. The goal was to deliver actionable intelligence that supports data-driven decision-making, enhances customer retention, and identifies growth opportunities.
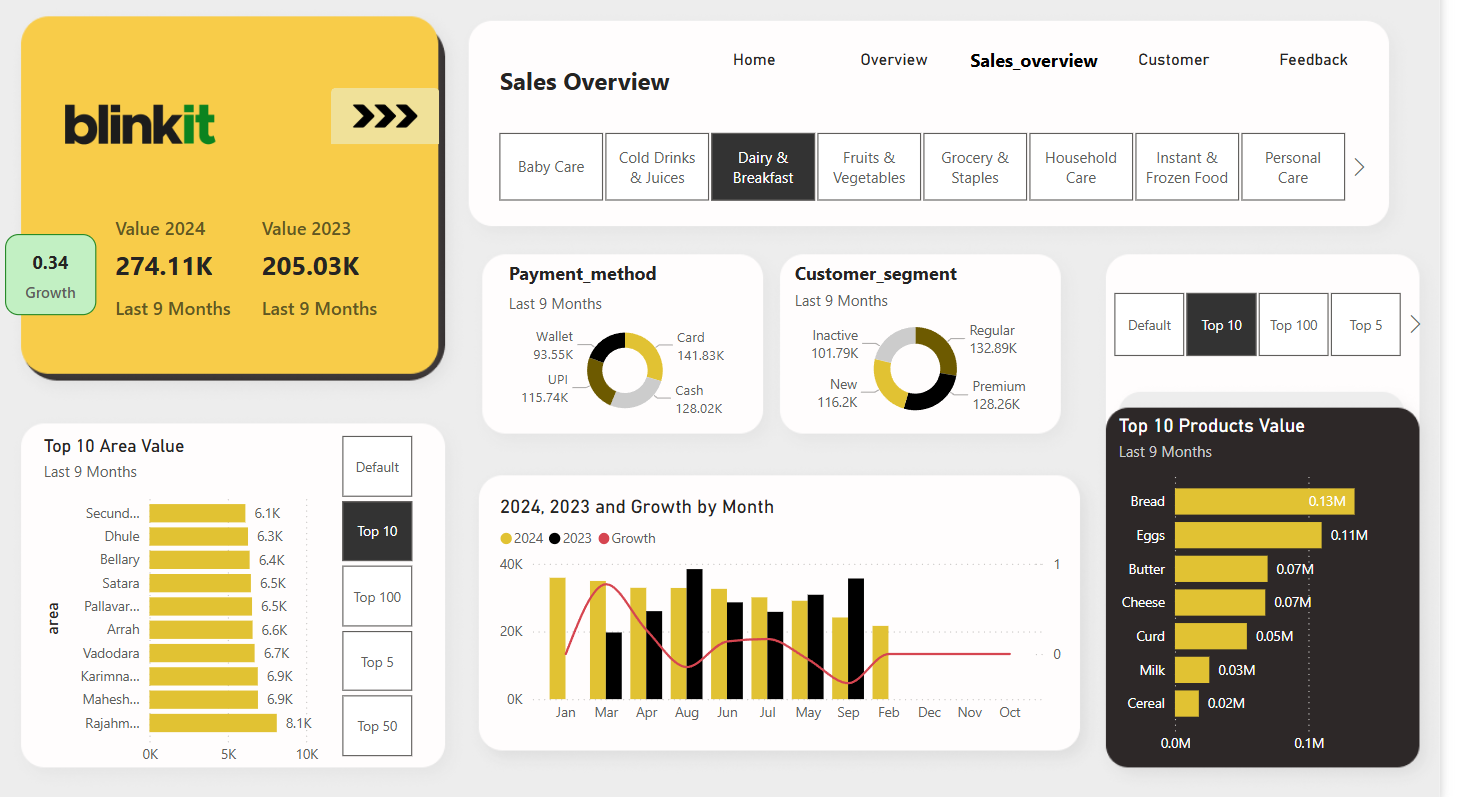
Sales Overview Report
+Analyzed sales performance across multiple dimensions including region, time period (monthly and yearly), and product categories. Implemented dynamic comparisons between current and previous year/month using time intelligence DAX functions to uncover sales trends and patterns. Calculated monthly and quarterly growth rates to highlight performance shifts and business opportunities. Additionally, categorized sales data by product category, payment method, and specific product types to identify key revenue drivers and optimize strategic decision-making.
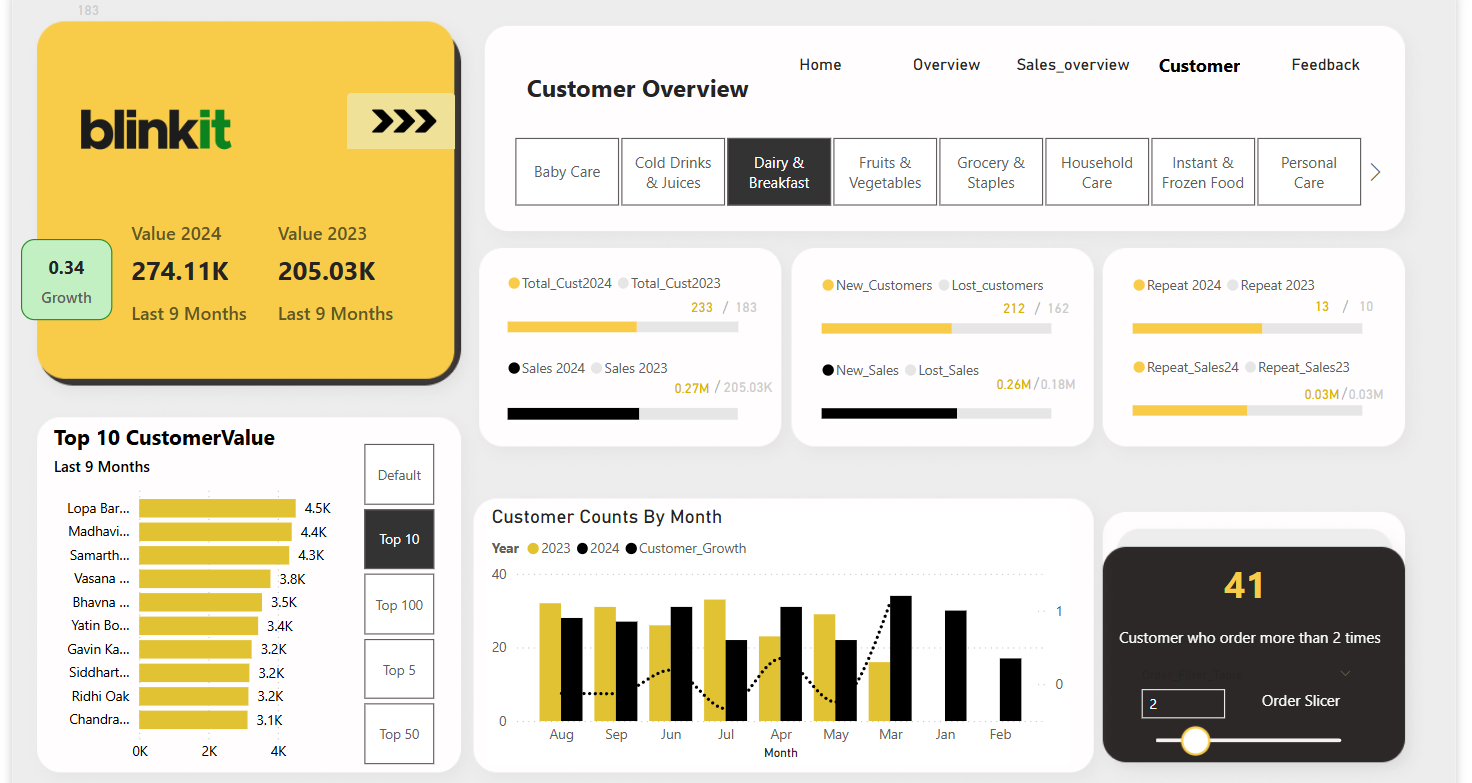
Customer Report
+Performed in-depth customer analysis to identify top-ordering customers, track repeat purchase behavior, and analyze preferences across product categories. Measured customer retention by comparing churn rates(The percentage of customers who stopped ordering or became inactive over a specific period (usually monthly or quarterly)) month-over-month and monitored new customer acquisition trends on a monthly, quarterly, and yearly basis. This analysis provided valuable insights into customer loyalty, behavioral patterns, and product affinity—helping to optimize customer engagement strategies and enhance lifetime value.
Feedback Report
+Analyzed customer feedback by categorizing reviews based on sentiment, product categories, and customer segments. This helped in identifying recurring issues, areas of improvement, and product-specific concerns. Segmenting feedback enabled a deeper understanding of customer needs and expectations, allowing the business to align offerings with demand and discover new product opportunities.
Skill Used
SQL
Data querying and database management
Power BI
Data visualization and dashboards
Figma
Design Theme and elements